

Numerous organizations collect statistics on traffic accidents each year.
Some of these statistics may surprise you.
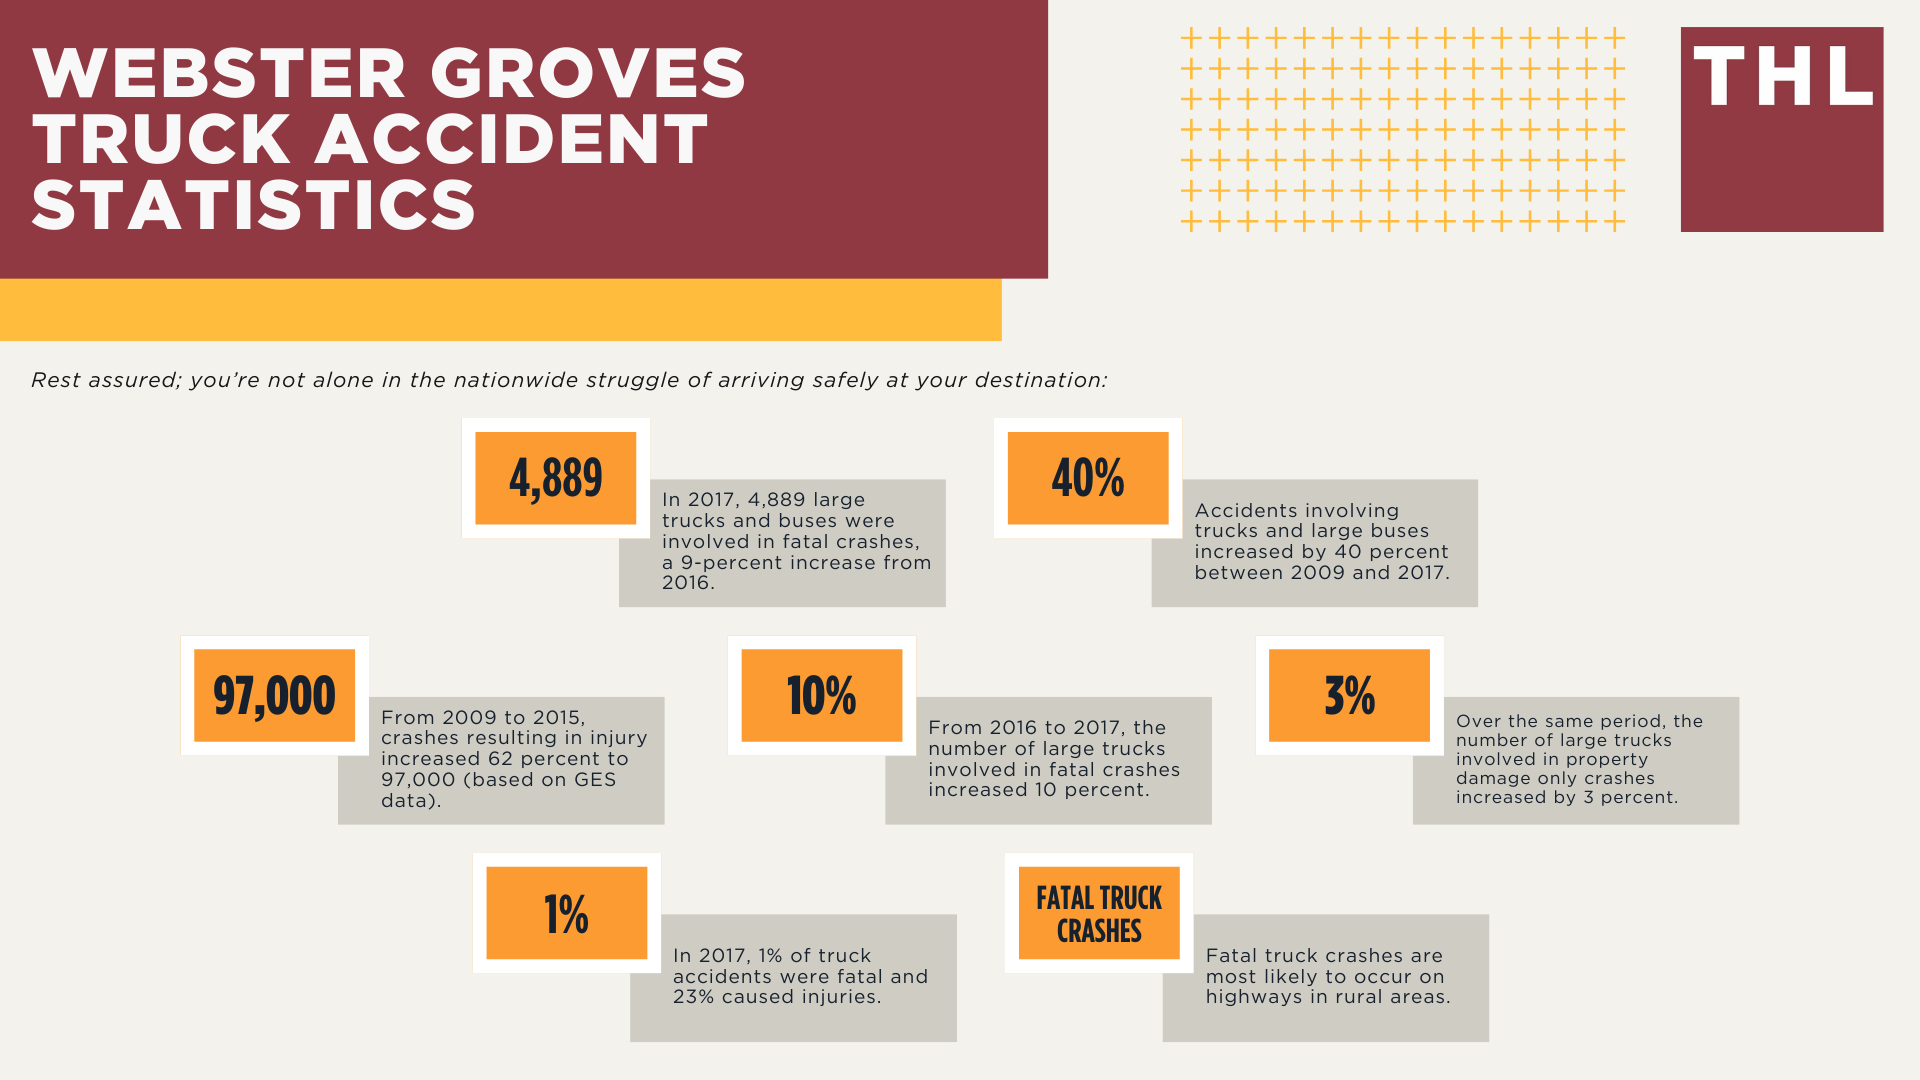
Rest assured, you’re not alone in the nationwide struggle of arriving safely at your destination:
- In 2017, 4,889 large trucks and buses were involved in fatal crashes, a 9-percent increase from 2016. Many of these crashes resulted in a wrongful death lawsuit.
- Accidents involving trucks and large buses increased by 40 percent between 2009 and 2017. From 2016 to 2017, the number of fatal crashes involving large trucks or buses increased by 8 percent.
- From 2009 to 2015, crashes resulting in injury increased 62 percent to 97,000 (based on GES data). From 2016 to 2017, according to NHTSA’s CRSS data, large truck and bus injury crashes increased 4 percent (from 112,000 in 2016 to 116,000 in 2017).
- From 2016 to 2017, the number of large trucks involved in fatal crashes increased 10 percent, from 4,251 to 4,657, and the large truck involvement rate (large trucks involved in fatal crashes per 100 million miles traveled by large trucks) increased 6 percent, from 1.48 to 1.56.
- Over the same period, the number of large trucks involved in property damage only crashes increased by 3 percent, from 351,000 to 363,000.
- In 2017, 1% of truck accidents were fatal and 23% caused injuries. Statistics like this are especially useful in the event of a bellwether trial.
- Fatal truck crashes are most likely to occur on highways in rural areas. Crashes that occur on someone else’s property may be subject to premises liability.